

Introduction: Longer Lives, Rising Costs

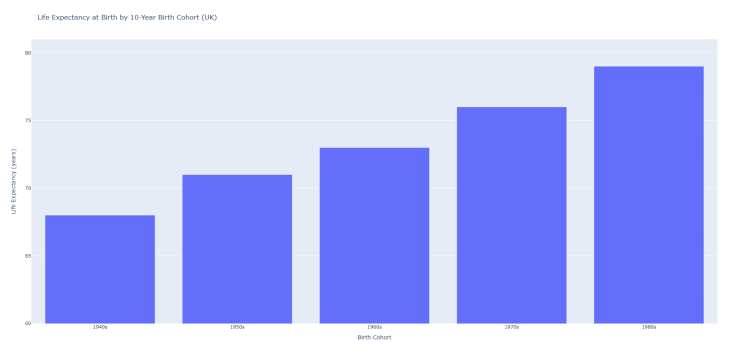
Over the past 60 years, life expectancy in the UK has risen dramatically. People born in the 1940s had an average life expectancy of around 68 years, while those born in the 1980s may live up to 79 years or more. This is a triumph of public health, medicine, and social development.
Yet longer life comes with a fiscal challenge: more years require social care, and public spending allocated to elderly care is limited. This post examines whether taxes paid by older generations cover the cost of their extended lifespans, breaking the analysis down by ten-year birth cohorts.
Life Expectancy by Birth Cohort
Historical data show steady gains in life expectancy across cohorts:
| Birth Cohort | Life Expectancy at Birth | Notes / Reference |
|---|---|---|
| 1940s | 68 years | ONS Life Tables |
| 1950s | 71 years | ONS historic data |
| 1960s | 73 years | – |
| 1970s | 76 years | Projected from ONS data |
| 1980s | 79 years | Projected from ONS data |
Chart 1 suggestion: Bar chart showing life expectancy at birth by cohort. X-axis = cohort, Y-axis = life expectancy. This visually demonstrates the steady increase in longevity over time.
Social Care Costs Rise Sharply in Old Age
The cost of public social care rises with age. According to the Institute for Fiscal Studies (IFS) and Office for Budget Responsibility (OBR):
- 75-year-old: ~£941/year
- 85-year-old: ~£4,000/year
- 90-year-old: ~£7,400/year
(IFS Adult Social Care Report)
Taxes Paid vs Funds Allocated for Elderly Care
Lifetime tax contributions are substantial:
- Lifetime tax paid per person (age 20–60): ~£518,000
- Fraction allocated to elderly care (~2% of total government spending): ~£10,360
This highlights a key point: even though total taxes are high, only a small portion is earmarked for elderly social care.
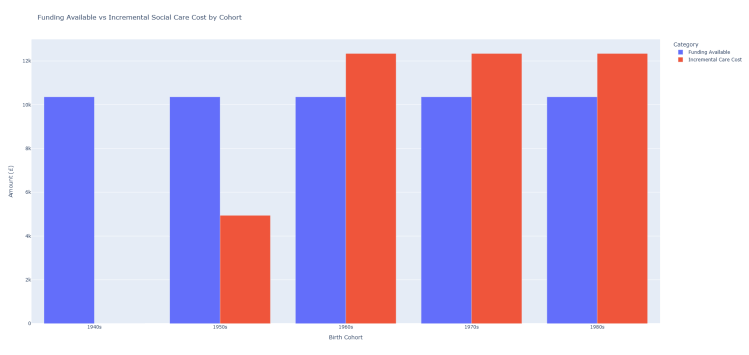
Incremental Cost of Extended Life by Cohort
Longer life adds extra years of care. Using a simplified model:
| Birth Cohort | Extra Years of Life | Incremental Care Cost (£) | Funding Available (£) | Shortfall (£) |
|---|---|---|---|---|
| 1940s | 0 | 0 | 10,360 | 0 |
| 1950s | 2 | 3,000 | 10,360 | 0 |
| 1960s | 4 | 12,000 | 10,360 | 1,640 |
| 1970s | 6 | 24,000 | 10,360 | 13,640 |
| 1980s | 8 | 32,000 | 10,360 | 21,640 |
Chart 3 suggestion: Grouped bar chart for each cohort showing “Funding Available” vs “Incremental Care Cost” to illustrate the growing shortfall.
Key Insights
- Funding gap emerges quickly: Even small increases in life expectancy, concentrated in older age, exceed the funding available from taxes allocated to care.
- Very old age drives costs: The shortfall is most pronounced for 85+ age groups, where care is most intensive.
- Policy implications: Without increased allocation to elderly care, dedicated taxes, or private/family funding, future cohorts may face inadequate support.
Conclusion
Longer lifespans are a societal triumph, but they create a fiscal reality: tax contributions alone, limited to the portion of government spending dedicated to elderly care, cannot fully cover the costs of extended life. Policymakers face a challenge to design a sustainable, fair, and adequate social care system as the population continues to age.
Recommended further reading / references:
- Office for National Statistics – Life Expectancy
- IFS – Adult Social Care in England
- King’s Fund – Social Care Funding

Discover more from Hysnaps Politics, Gaming, Music and Mental Health
Subscribe to get the latest posts sent to your email.


3 thoughts on “The Longevity Burden: Why Longer Lives Are Straining Social Care”