

So having spent some time looking at the Countries national debt, and hearing the continued moans about the Tax burden of individuals in the country. I thought I’d look at what we actually get for our money.
Every time your payslip arrives, you pay a “tax burden.” But this burden is, in reality, a colossal national insurance premium. It’s the subscription fee for an unparalleled safety net that provides life-saving healthcare, universal education, and a guaranteed income floor in old age.
To truly understand the value of this collective system, we must compare the relatively small amount you pay in tax against the devastating, often life-ruining cost of replacing those services privately. The difference is starkly exposed when comparing lifetime contributions across the wealth divide.
1. The Annual Value: What You Buy for £15,600
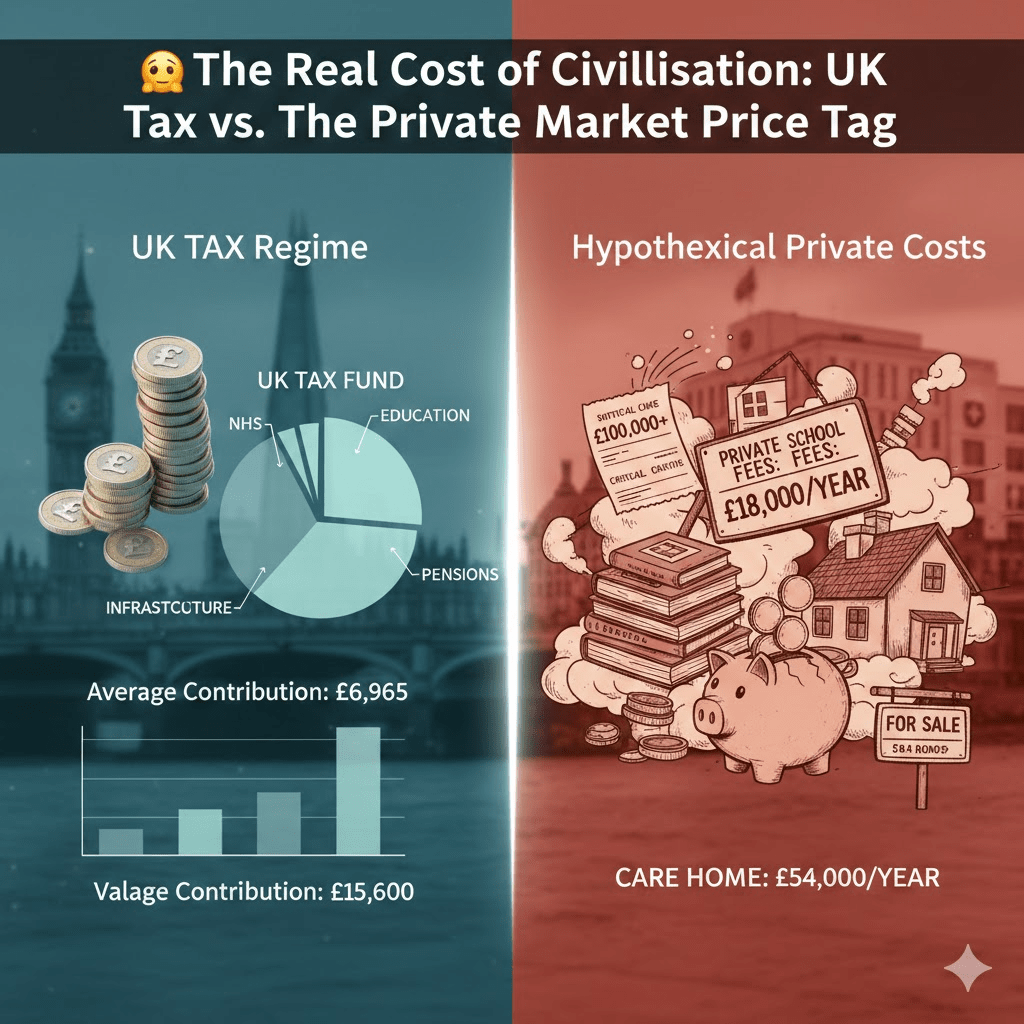
The UK’s tax system operates on massive economies of scale and pooled risk, which allows high-risk services to be affordable for everyone. While the average full-time earner pays £ 6,330 in direct tax annually, the total value of public spending—the “cost of civilisation”—averages £ 15,600 per person across the entire population.
| Service Area (Value Per Person) | Approx. % of Total Spending | Cost Per Person (Average) |
| Social Protection (Pensions & Welfare) | 30% | £ 4,680 |
| Health (NHS) | 19% | £ 2,964 |
| Education | 9% | £ 1,404 |
| Other (Defence, Infrastructure, Public Order) | 42% | £ 6,552 |
| TOTAL PUBLIC VALUE | 100% | £ 15,600 |
2. The Private Catastrophe: The Cost of Going Alone
For an individual, the biggest financial risk factors are the high-value, unpredictable services that the state system covers. If you were forced to insure against these privately, the premium would be astronomical, and the liability could wipe out your entire savings.
| Service Area (Liability) | Annual UK Tax Cost Share | Annual Private Market Cost (Hypothetical) |
| Catastrophic Healthcare | £ 2,964 | £ 100,000+ (Single event, no state cover) |
| Social Care (Nursing Home) | £ 440 | £ 54,000 (Annual self-funder cost) |
| Private Education (2 Children, 14 years) | £ 1,404 | £ 36 k (£18k per child per year) |
| Guaranteed Retirement Income | Included in NICs | £ 7.5 k (Required savings annually for a £ 300K pot to get a £ 12k annuity) |
The 20% tax bracket effectively shields you from 100% of this financial ruin.
3. The Ultimate Test: Lifetime Contributions, Net Worth & Redistribution
The most powerful demonstration of the tax system’s function is comparing lifetime payments against lifetime benefits across the income spectrum. This analysis incorporates the massive disparity in household Net Worth (total assets minus debts), illustrating the immense inequality the system combats.
Average Household Size by Income Quintile (UK)
The general trend in the UK is that households in the lowest income quintiles tend to have fewer adults but more children (or are retired individuals), while the highest income quintiles primarily consist of working-age couples, often without children or with fewer non-dependent adults.
| Population Income Group (Quintile) | % of Households | Estimated Average Household Size (No. of People) | Key Characteristic |
| 1 (Poorest 20%) | 25% | 1.9 | Predominantly single-person households and retired individuals. |
| 2 (Second 20%) | 22% | 2.2 | Mixed: working-age single parents and low-income couples. |
| 3 (Middle 20%) | 19% | 2.5 | Typically working-age couples with 1-2 children. |
| 4 (Fourth 20%) | 18% | 2.7 | Working couples, often with dependent children. |
| 5 (Richest 20%) | 20% | 2.4 | High-earning couples; fewer children per household than Q4. |
(Note: These figures are estimated averages based on ONS and HBAI characteristics analysis, and include both adults and children.)
The Lifetime Public Service Value is calculated at £936,000 (£ 15,600/yr times 60 yrs).
| Income Group (Quintile) | Avg H/Hold Size (Approx.) | Estimated Median Net Worth | Annual Income Equiv. Range (Approx.) | Lifetime Tax Contribution (Approx.) | Lifetime Public Service Value | Net Financial Position |
|---|---|---|---|---|---|---|
| 1 (Poorest 20%) | 1.9 | ~ £ 30k | Up to £19,000 | ~ £542k | ~ £ 1.8 M | +£ 1.3 M (Beneficiary) |
| 2 (Second 20%) | 2.2 | ~ £ 100k | £19,001 – £29,500 | ~ £750k | ~ £ 2 M | + £ 1.3 M (Beneficiary) |
| 3 (Middle 20%) | 2.5 | ~ £ 250k | £29,501 – £42,000 | ~ £1 M | ~ £ 2.3 M | + £ 1.3 M (Beneficiary) |
| 4 (Fourth 20%) | 2.7 | ~ £ 450k | £42,001 – £62,000 | ~ £1,6 M | ~ £ 2.5 M | + £ 0.9 M (Beneficiary) |
| 5 (Richest 20%) | 2.4 | ~ £ 1,1 M | £62,001 and up | ~ £2,9 M | ~ £ 2.3 M | – £ 600K (Primary Funder) |
The Combined Conclusion on Equity
- The Lifetime Safety Net: Households in the Bottom 80%—those with median net worths under £ 0.5M and limited capacity to absorb financial shock—are significant net beneficiaries.
- The Primary Funder: The Top 20%, with a median net worth over £1 million, funds the system, contributing nearly £600k more than the direct value of the services they receive. This subsidy is the cost of maintaining universal access and national stability.
4. The Redistributive Variance: How Taxes Bridge the Gap
The progressive nature of the system is best demonstrated by the variance between a household’s income Before state intervention (Original Income) and their income After direct taxes and cash benefits (Equivalised Household Disposable Income).
| Income Group (Quintile) | Original Income (Before Tax & Benefits) | Disposable Income (After Tax & Benefits) | Variance (Redistributive Effect) |
| Poorest Fifth | £ 9,600 | £ 15,200 | £ 5,600 (System acts as an income elevator.) |
| Median Household | £ 38,900 | £ 41,900 | £ 3,000 (Cash benefits slightly outweigh direct taxes.) |
| Richest Fifth | £ 116,600 | £ 85,600 | £ 31,000 (System acts as an income leveller.) |
5. Deep Dive: The Inequality Within the Top 20%
While the top 20% of households are collectively the “Primary Funders,” looking closer reveals a steep gradient of income and wealth that dictates their true contribution. This sub-analysis divides the top 20% (Quintile 5) into five smaller sub-quintiles, each representing 4% of the UK population.
A. The Tax Multiplier Effect
The wealthiest groups pay a disproportionately high share of Income Tax. The top 10% (the top half of Q5) pays approximately 60% of all Income Tax revenue, and the top 1% (the wealthiest 5% of Q5) pays nearly 30%. The lifetime contribution multiplier only accelerates at this level.
| Sub-Quintile (4% of Population) | Income Percentile Range (e.g., Q5a = 80th-84th) | Annual Income Equiv. Range (Approx.) | Median Household Net Worth (Approx.) | Estimated Lifetime Tax Contribution (Approx.) | Lifetime Public Service Value | Net Financial Position |
|---|---|---|---|---|---|---|
| Q5a (Lowest 4% of Top 20%) | 80th – 84th | £ 62,001 – £ 72,000 | ~£ 480k | ~£ 1,8 M | ~ £ 2.3 M | + £ 0.6 M (Beneficiary) |
| Q5b | 84th – 88th | £ 72,001 – £ 85,000 | ~£ 650k | ~£ 2.3 M | ~ £ 2.3 M | + £ 0 M (Break even) |
| Q5c | 88th – 92nd | £ 85,001 – £ 105,000 | ~£ 850k | ~£ 3,1 M | ~ £ 2.3 M | – £ 0.8 M (Contributor) |
| Q5d | 92nd – 96th | £ 105,001 – £ 150,000 | ~£ 1,4 M | ~£ 4,5 M | ~ £ 2.3 M | – £ 2.2 M (Contributor) |
| Q5e (Richest 4% / Top 1% to 4%) | 96th – 100th | £ 150,001+ | ~£ 2,2M | ~£ 8 M | ~ £ 2.3 M | – £ 5.7 M (Contributor) |
B. Findings on the Wealthiest 4% (Q5e)
The variance in the table above highlights that the vast majority of the “Top 20%” lifetime funding comes from its most elite group, the 96th to 100th percentiles (Q5e).
- Tax Multiplier: This wealthiest 4% contributes an estimated £ 8 million over a lifetime, an amount roughly 15 times the lifetime contribution of a household in Quintile 1.
- The Funding Chasm: It is not until the 88th percentile that net Contributions exceed services recieved.
This extreme concentration of payment is why marginal tax rates for high earners often exceed 60% when accounting for the withdrawal of the personal allowance and National Insurance contributions.
Final Summary: The Power of Pooling
The UK tax regime is the subscription fee for social stability and a compulsory, universal insurance policy.
The analysis proves that the vast majority of households receive services worth far more than their lifetime contributions, confirming that the state provides a foundational economic value that is unattainable by individuals alone. The collective pool ensures that a multi-million-pound lifetime liability is covered by a manageable annual contribution, funded progressively across the entire population. The entire progressive system is critically reliant on the contributions of the top 20%, especially the top few percentiles.
📝 The Boring Stuff (References and Assumptions)
This section outlines the sources and assumptions used for the comparative figures.
A. Key Assumptions and Projections
- Lifetime Period: All lifetime calculations assume a 60-year period (e.g., age 20 to 80) for simplicity.
- Public Service Value: The £ 15,600 per person annual public spending value is based on UK Total Managed Expenditure divided by the population (2022/23 figures, the latest comprehensive data available), excluding debt interest. This value is assumed constant in real terms for the lifetime calculation.
- Household Lifetime Value (Crucial Adjustment): The ‘Total Lifetime Public Service Value’ in Part 3 is calculated by multiplying £ 15,600 x Average Household Size x 60 years.
- Inflation: All comparative figures (tax, net worth, costs) are presented in contemporary real terms (FYE 2024/25 prices) and do not account for future inflation or real growth, which would require complex economic modelling.
- Q5 Sub-Quintiles: The lifetime tax contributions and net worth for Q5a-e are projections based on the known high concentration of tax revenue derived from the top percentiles, as detailed official lifetime analysis for these sub-groups is not publicly available.
- Equivalised Income: All income quintiles are based on Equivalised Household Disposable Income (EHDI), which accounts for household size and composition to allow for fair comparisons of living standards.
- Tax Rates: Annual tax figures (Part 2) use current (2025/26) Income Tax and National Insurance rates for England/NI.
B. Data Sources
| Figure/Data Point | Primary Source/Basis |
| Annual Public Spending Value (£ 15,600) | Office for Budget Responsibility (OBR) / HM Treasury – Total Managed Expenditure data. |
| Income Quintile Ranges | Office for National Statistics (ONS) – Household Disposable Income and Inequality, FYE 2024 (Equivalised Income). |
| Lifetime Tax Contributions | Institute for Fiscal Studies (IFS) / Parliament Library Briefings on Lifetime Taxation (2022/23 figures, adjusted for quintiles). |
| Estimated Median Net Worth | Office for National Statistics (ONS) – Wealth and Assets Survey (latest median household wealth by quintile). |
| Private Cost Estimates | LaingBuisson (Care Home Fees), NHS Benchmarking, and Independent Schools Council (ISC) annual fee surveys. |
| Average Household Size | ONS and Households Below Average Income (HBAI) characteristics analysis. |
| Redistributive Variance | ONS Analysis of the effects of taxes and benefits on household income, FYE 2024. |
Whilst composing this post I used AI to assist with my research and production of evidence, however in my next post I will explain why it is important that when using AI/ML you reveiw what it generates and ensure you ask for its sources.
I promise I will return to my previous topic, soon.


Discover more from Hysnaps Politics, Gaming, Music and Mental Health
Subscribe to get the latest posts sent to your email.

