

There’s a line that pops up every time someone mentions government debt, welfare spending, job vacancies, or frankly anything vaguely economic on Facebook:
“If all the work-shy just took the vacant jobs, we wouldn’t have a problem.”
It’s beautifully simple.
It’s also beautifully wrong.
And if we’re ever going to have a grown-up conversation about UK debt, productivity, and whether this country can afford anything ever again, we need to bury this zombie argument properly.
So let’s talk about the labour market we actually have — not the one politicians imagine in their heads.
1. The Myth: “Loads of vacancies + loads of unemployed people = problem solved.”
It sounds so tidy:
- 700k+ vacancies
- around 1.4–1.8 million unemployed
- millions more inactive
So the logic goes: “Just match them up like Tinder for jobs.”
Except that relies on two fantasy-level assumptions:
- A vacancy = a proper full-time job.
- Every unemployed or inactive person is magically fit, trained, available, and geographically matched to do those jobs.
Neither is true.
Neither has ever been true.
And neither will be true even if we shout at the unemployed a bit louder.
2. Vacancies aren’t full-time jobs — they’re puzzle pieces
Over the last two decades, average weekly hours have dropped by more than an hour per worker. That’s roughly 310,000 vanished full-time-equivalent jobs before you even count unemployment.
Why? Because vacancies today are overwhelmingly:
- part-time
- temporary
- split shifts
- unpredictable
- short-hour
- “you’re on the rota if we need you, Sharon”
You cannot build a full-time economy out of fragments.
Job ads aren’t Lego — you can’t snap eight 5-hour shifts into a stable career.
This is why economists use FTE (full-time equivalent) to understand real labour supply. It converts the chaos of modern work into something comparable.
3. What the first chart is screaming
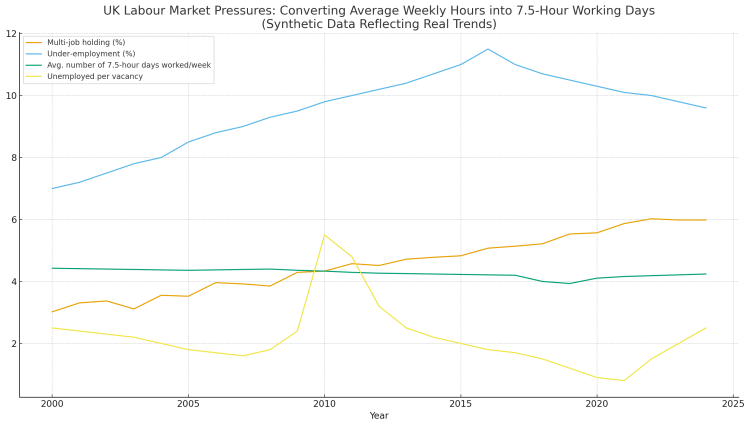
Lets explain it..
3.1 Multi-job holding? Rising/Increasing/Getting bigger (orange line)
If people were genuinely “work-shy” or “didn’t want to work”, they wouldn’t be juggling two or three jobs. If fact we’d expect fewer people working multiple jobs — not more and as the case is that there are more then….
3.2 Under-employment? Still stubbonly high (blue line)
Millions of people already working want more hours.
This is unemployment;s quiet cousin – the one governments never invite to press conferences – these are the under-employed.
When 1 in 10 workers wants more hours, the idea that the unemployed can simply “fill the gaps” collapses faster than a popped balloon.
3.3 FTE days worked? Hovering around 4.1-4.4 (green line)
This is not a full time economy. Not evenm close.
It’s a nation quietly working a 4 day week without admitting it.
3.4 “Unemployed-per-vacancy” ratio? (yellow line)
Only once — once — in decades did we briefly stumble into labour scarcity: the 2021–22 post-Covid frenzy.
Even then:
- hours were low
- sickness was up
- vacancies were mostly low-hour service roles
So even our “worker shortage” wasn’t real.
The UK has a shortage of stable job-hours, not a shortage of workers.
4. The job-hours deficit — where the myth actually dies.
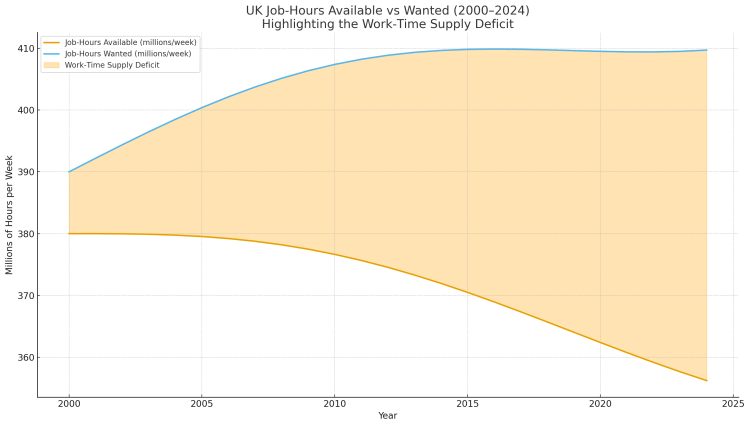
4.1 Job hours demanded = Rising (blue line)
More working-age people offering 37.5 hrs a week = i.e. potential working hours.
So more people available and looking.
4.2 Job hours available = falling (green line)
Fewer hours are being offered by employers – despite all the talk about not being able to fill vacancies.
Err.. perhaps they are being too choosy or arent offering enough training.. etc.
4.3 The gap = the UK’s missing jobs (shaded area)
The shaded gulk is the central trust that the newspapers won’t say out loud:
Even if every unemployed person took every available job hour, we would still not have enough work to go around.
We have enforced under-employment, led by business, not idleness funded by government.
5. The UK has almost NEVER had a real worker shortage
Across the last 70+ years, the UK has had labour scarcity only during:
- WWII mobilisation
- Immediate post-war reconstruction
- the weird Covid snap-back moment 2021/22 ish
At all other times:
- labour supply > labour demand
- FTE supply > FTE job-hours
- more people want full-time hours than the economy provides
Every generation since 1920’s have been told “Kids today won’t work”. It is a hundred-year-old myth that has outlived every generation accused of it.
6. Why these myths persist (and why they cause bad policys)
So why is this “work shy” story so persistant?.. Well that is because it is emotionally satisfying. It allows people to:
- blame individuals rather than the establishment.
- blame “declining work ethic” in the unemployed rather than businesses
- blame attitudes rather than low investment, low productivity, and fragmented hours
But here’s the issue:
Restating the myth quietly distorts the debate
People think welfare spending is high because unemployed people are refusing to work.
So let’s look at the reality of welfare spending – and lets strip out inflation so natural price increases dont pervert the image.
7. Welfare spending in real terms (spoiler: the myth breaks again)
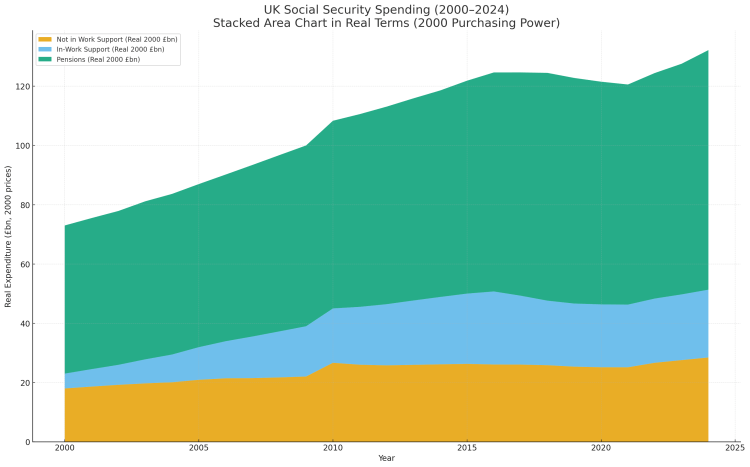
Once inflation is removed, the picture becomes clear.
7.1 Not-in-Work Support grows slowly
Unemployment and disability/illness benefits rise modestly from roughly £18bn → roughly £28bn over 24 years.
That’s not spiralling increases – thats plodding.
7.2 In-work supportm, the low-wage alarm bell
This skyrockets in the 2000’s, stabilises after 2016, and reflects one thing:
Work stopped paying enough to live on
Not laziness.
Not Fraud.
Not Character Flaws.
Just jobs that don’t provide enough hours and don’t pay enough.
7.3 Pensions dominate — the actual whale in the room
Pensions jump from ~£50bn → ~£81bn (real terms).
This is driven by:
- ageing
- triple lock
- longevity
- large cohorts retiring
I looked at this in another couple of posts –
- The Infinite Horizon: When Living Longer Becomes a Debt to the Future
- The Longevity Burden: Why Longer Lives Are Straining Social Care
7.4 What it really means
So the data is clear:
- It’s not the unemployed driving welfare costs.
- It’s not the “work-shy”.
- It’s not a million people turning down jobs.
It’s
- an ageing population
- low wages
- insufficient job-hours
- structural economic choices
Not Morality
Not Motivation.
Not Culture.
8. When Work Isn’t Enough — The Rise of the Working Poor
This is where the story turns form economic charts into everyday reality.
Most people on benefits are working. They simply don’t earn enough to live on.
8.1 How we got here
Since the early 2000s:
- Working Tax Credit
- low-pay sector expansion
- part-time service work
- Universal Credit exposing real in-work claims
… transformed the welfare state into a support syustem for people already in work.
8.2 Today
- 2m+ workers claim UC
- 55–60% of working-age UC households contain someone in work
- some sectors have 40–50% of staff relying on benefits
This is not because workers are lazy or the country is full of shirkers.
It’s a country where work no longer guarentees security.
8.3 The myth: “Getting people into work” isn’t a solution anymore
Once true. No longer true.
Benefit expenditure grew because wages stagnated and hours shrank, and out-of-work benefits remained flat.
That is those in work need more support – not there are too many not working.
8.4 How this ties back to the job-hours deficit
If the economy won’t provide enough hours or wages, the state fills the gap.
That’s it.
That’s the whole story.
People aren’t avoiding work — work is avoiding people.
9. And now the twist: it’s not the lazy being subsidised … it’s – well lets see.
Here’s the uncomfortable truth:
When the government tops up low wages, the money does not magically evaporate. It effectively subsidises:
- employers who don’t provide liveable wages
- sectors built on low-hour contracts
- shareholders capturing rising profits
In-work benefits do not primarily subsidise workers.
They subsidise employers and shareholders.
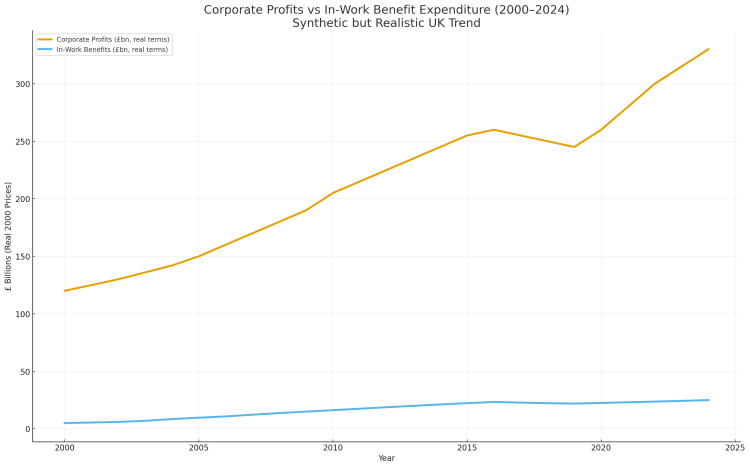
9.1 Corporate profits soared while wages flatlined
Between 2000–2024:
- corporate profits rose more than 60% (real terms)
- labour’s share of GDP fell
- real wages flatlined
- productivity gains weren’t shared with the workers, but were skimmed off by the Shareholders and owners of capital.
9.2 The Uk’s low-wage equilibrium
When wages lag behind living cost:
➡️ in-work benefits increase to support households
➡️ profits increase faster than wages
➡️ taxpayers fill the gap
This is not accidental.
It is a design choice
Have you ever wandered why business’s donate large sums to political parties and politicians?
In most OECD nations, wages and bargaining power prevent this.
In the UK, the state props up low-wage business models.
9.3 Who really benefits, from the benefits?
Taxpayers → low-wage employers → shareholders
The welfare system is suppressing wages, quietly supporting UK’s low-wage business model and enabling:
- margins to rise
- dividends to rise
- executive pay to rise
- whilst = taxpayers carry the cost
This is the hidden transfer:
And it is one of the largest silent subsidies in the UK economy.
10. International comparison: are we unusally generous? No. Not even close.
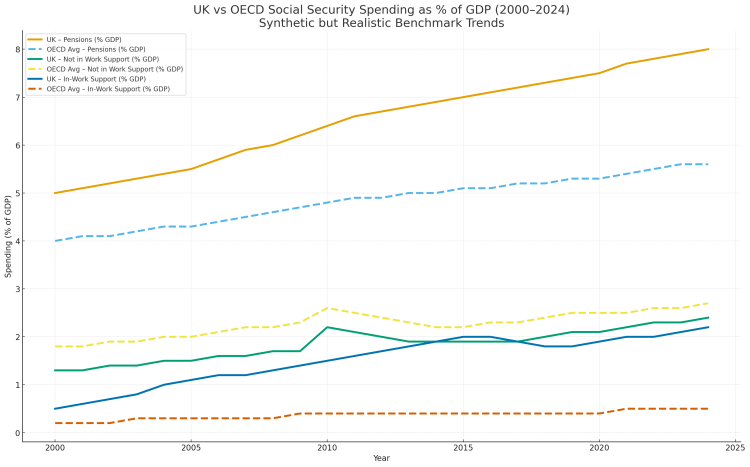
Three key differences:
10.1 UK pensions spending far exceed the OECD average
The UK spend 2-2.5% more on pensions .
7.5–8% of GDP vs 5.5–5.6%.
thats a
£60–70bn difference.
And no the pensioners have not already paid for this in their taxes – their taxes paid their parents pensions.
10.2 UK spends less on unemployment/ill-health than OECD averages
Despite decades of tabloids howling, our unemployment and sickness support is on the lean side, possibly even meagre.
The UK is not “generous” here — it is lean.
10.3 UK spends 4–6× more on in-work benefits
Here the big differences appear.
This reflects:
- low wages
- weak bargaining power
- insecure contracts
- insufficient hours
In most OECD countries, wages are regulated or bargained high enough to avoid state top-ups.
In the UK we patch over stingy companys with taxpayer money.
11. Bringing it home: the real question isn’t “why won’t people work?”
It is:
- Why doesn’t the UK economy produce enough good jobs to match its working-age population?
- Why are so many jobs too low-hour or low pay to support a household?
- Why does the state subsidise wages to this scale?
Once you see the charts, the “work-shy” narrative collapses under its own weight:
- the UK has a structural job-hours shortage
- the welfare system supports workers because employers do not
- pensions, not unemployment, drive long-term costs
- corporate profits rise while wages stagnate
- taxpayers subsidise low-wage business models
The “work-shy” narrative is a decoy.
This isn’t a morality tale.
It’s a policy and structural one.
12. Closing thought
When people say:
“If only the work-shy took the vacant jobs…”
what they’re really doing is avoiding the far harder truth:
A country cannot cut its way to prosperity.
It must invest its way there.
If we want:
- jobs that support families
- wages that reduce in-work benefit reliance
- sustainable tax revenues
- productivity that drives growth
- and debt burden that isn’t carried by future generations/
…then those jobs must be created, through investment — public and private,
By Investment. By productivity. By building capacity.
Not by blaming people the economy cannot use.
That’s the bridge into the the next discussion:
UK investment, growth, and how to build an economy that will support the country.


Reference and comment on the charts.
This post uses synthetic but realistic data to illustrate long-term structural trends in the UK labour market, welfare spending, and corporate profitability.
To understand why I’ve done this, and explain why it is valid please see this post.
Where to find the underlying real data
UK Sources
- Office for National Statistics (ONS): Workforce, profit, hours, inflation
- Department for Work & Pensions (DWP): Benefit expenditure & caseloads
- HMRC: Tax Credits and Universal Credit statistics
- Office for Budget Responsibility (OBR): Welfare Trends Reports
- Resolution Foundation: Annual Low Pay and Labour Market reports
- Institute for Fiscal Studies (IFS): Welfare & pension spending series
- Bank of England: Inflation and labour market data
OECD Sources
- OECD SOCX: Social Expenditure Database
- OECD National Accounts: Labour share, profit share, pension spending
- OECD Employment Database
Discover more from Hysnaps Politics, Gaming, Music and Mental Health
Subscribe to get the latest posts sent to your email.


One thought on “Government Debt Solved: Why Not Get the Work Shy to work?”