

We’ve already established something awkward.
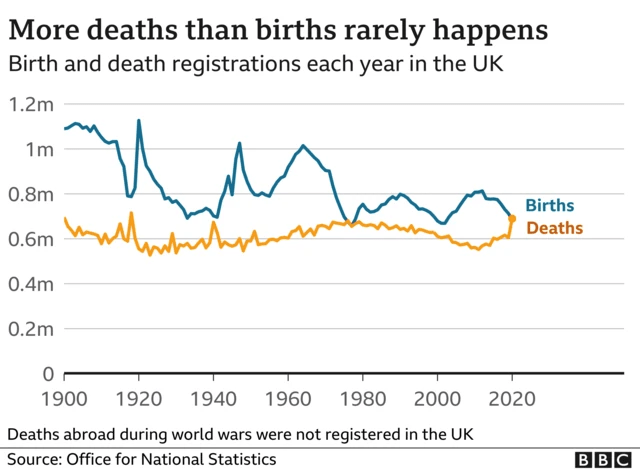
UK population growth isn’t “out of control”.
It isn’t even growing.
Births and deaths are roughly balanced. Natural growth has stalled.
Which immediately raises a second question:
Why, then, is the conversation around population so angry?
And why does it keep circling the same targets?
Migrants.
Women.
LGBTQ+ people.
Different decades, different villains — same energy.
Let’s slow it down and check whether any of those explanations actually fit the numbers.
“It’s migration”
This is usually the first stop.
And it’s understandable. It’s visible, well in the press and on the news a lot. It’s recent — or at least feels that way — and it’s noisy. Oh so very noisy.
But here’s the problem.
Migration didn’t cause population growth to change.
It arrived after natural growth stalled.
Birth rates fell first. Death rates rose slowly. The gap closed.
Once that happened, migration became the thing that stopped the population shrinking outright — keeping the workforce going, keeping services staffed, keeping the tax base from collapsing.
Which is why migration becomes controversial after natural growth stalls, not before.
It isn’t the cause.
It’s the pressure valve.
Blaming it is mistaking the response for the trigger.
“It’s ethnicity”
This one often hides inside the migration argument.
The idea that certain ethnic groups are “driving” pressure on services or child welfare.
So let’s anchor this properly.
Most children in England are UK-born.
Most children involved in social services are therefore also UK-born.
When outcomes are measured per 10,000 children, housing tenure — not ethnicity — shows the strongest gradient.
Roughly speaking:
- Owner-occupied housing: about 2–2.3% of children assessed as “in need”
- Secure social rent: about 4–4.5%
- Private rented housing: about 5.5–6%
The same pattern holds for children entering care.
Children growing up in insecure private renting are roughly three times as likely to require intervention as those in owner-occupied homes.
That pattern holds across ethnic groups.
Some communities do show higher rates — but those children are overwhelmingly UK-born, often second or third generation. The pressure tracks housing insecurity and poverty, not background.
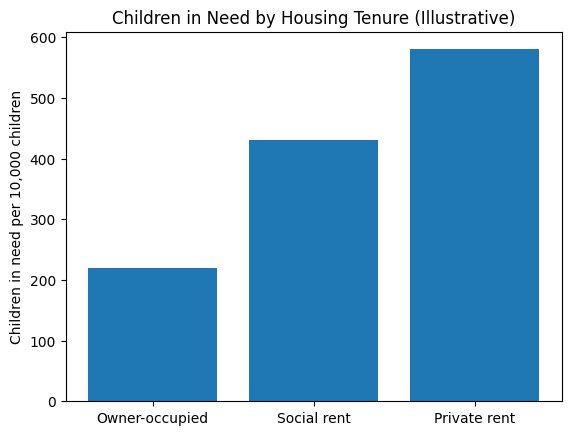
Illustrative rates based on DfE Children in Need census patterns. Values rounded to show scale and gradient, not precise annual counts.
“It’s women choosing careers”
This one has remarkable staying power.
The idea that women’s independence “caused” fertility to fall.
But it collapses the moment you step outside the UK.
Across rich countries:
- Female employment rose decades before fertility collapsed
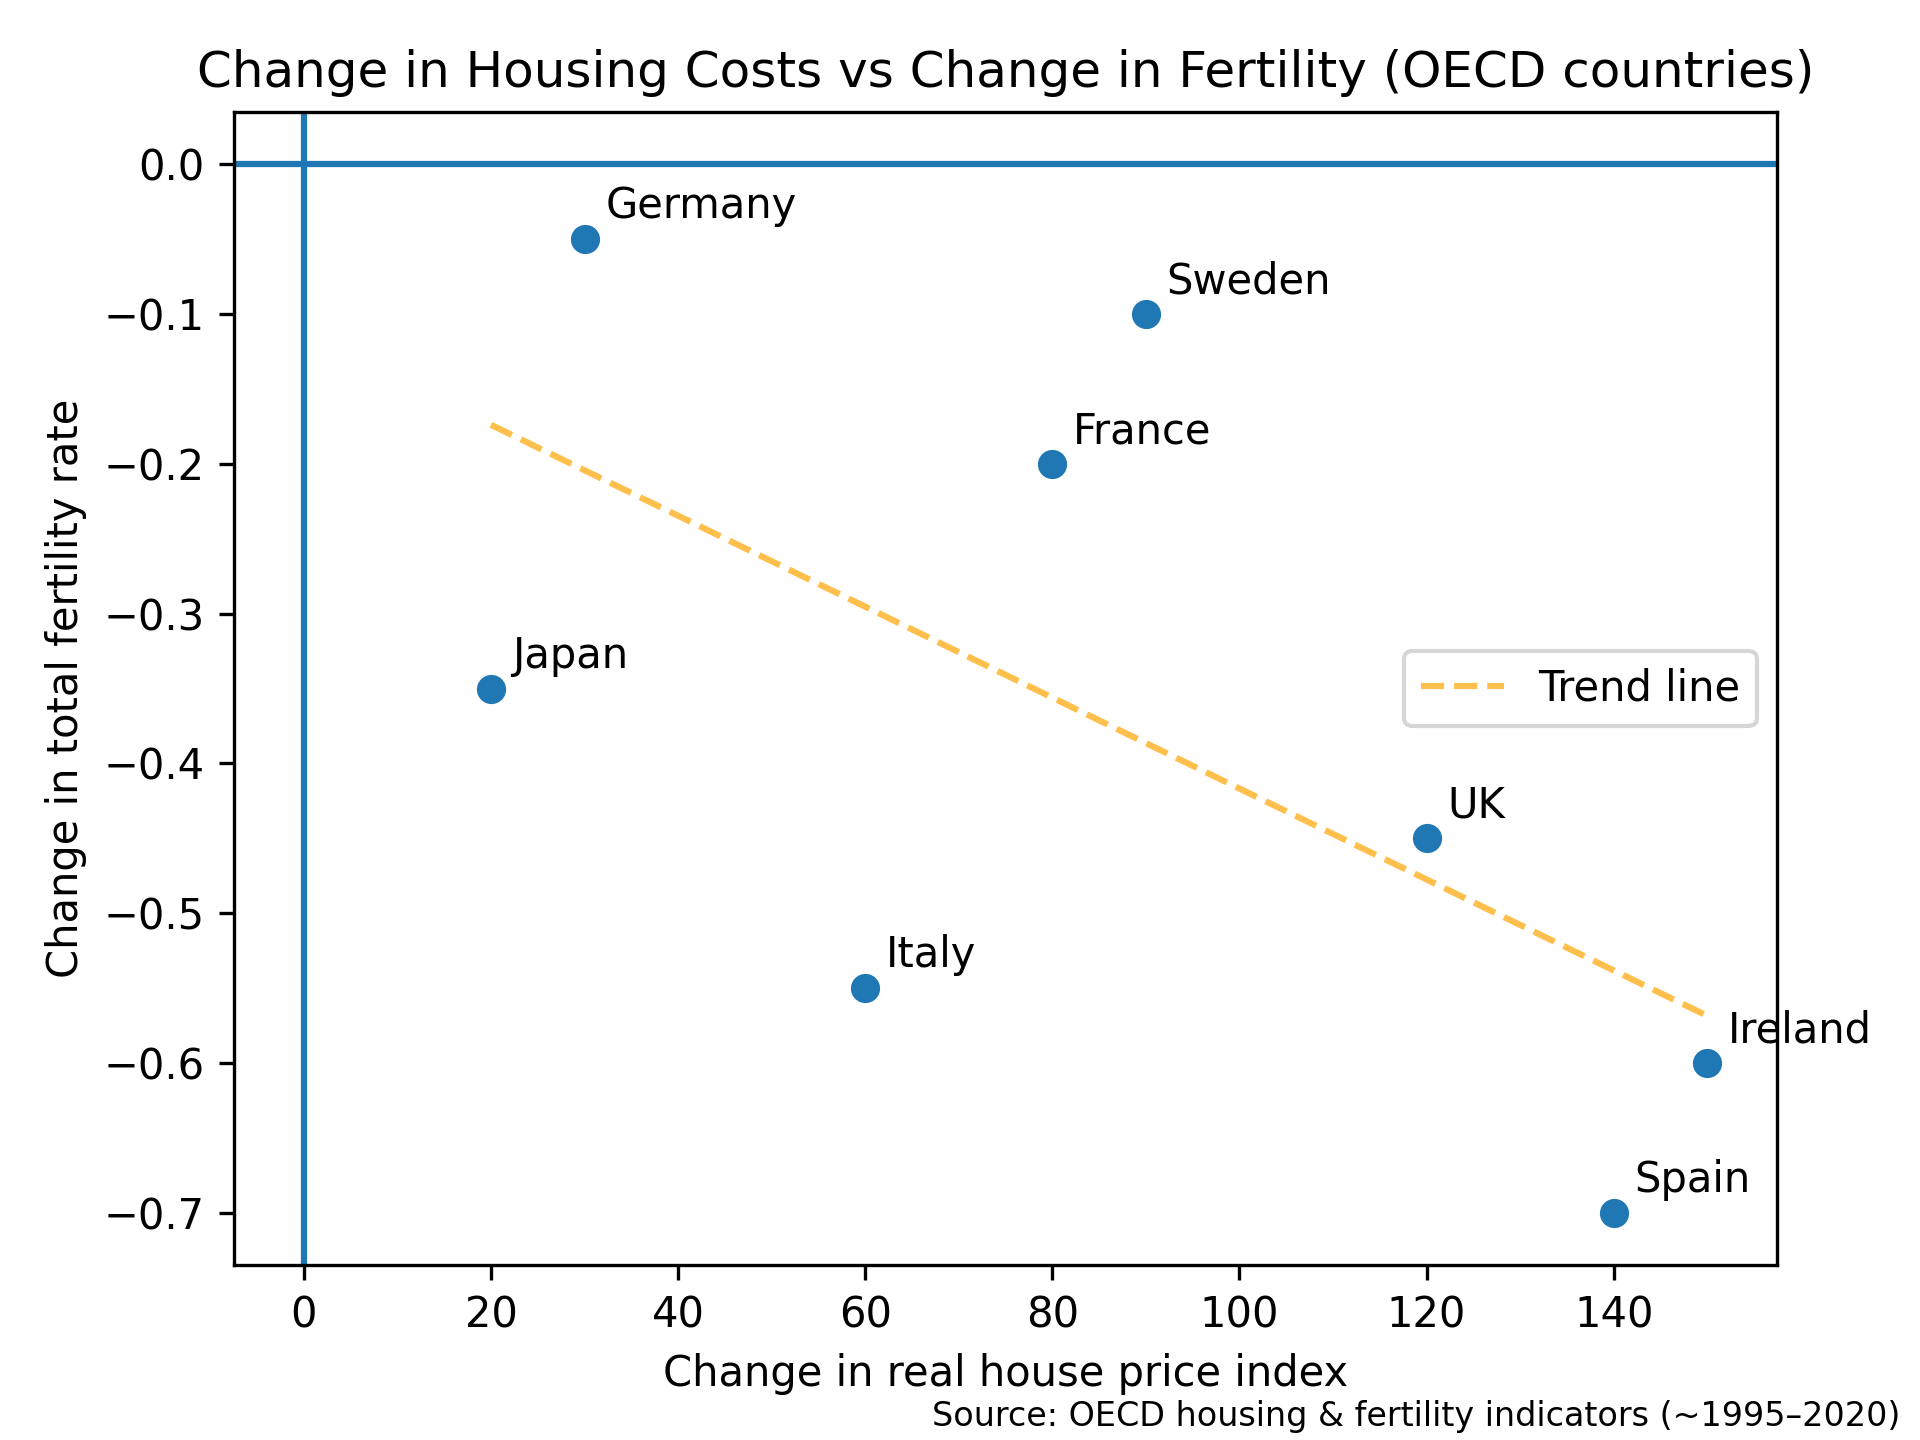
- Countries with the highest female employment often have higher birth rates
- Countries with expensive, insecure housing and weak childcare support have the lowest birth rates
Women didn’t stop having children because they gained options.
They stopped because the conditions under which families used to form were dismantled.
When housing is unstable, childcare expensive, and long-term planning risky, births fall.
Not because of ideology.
Because of risk.
Graph 3 (representative):
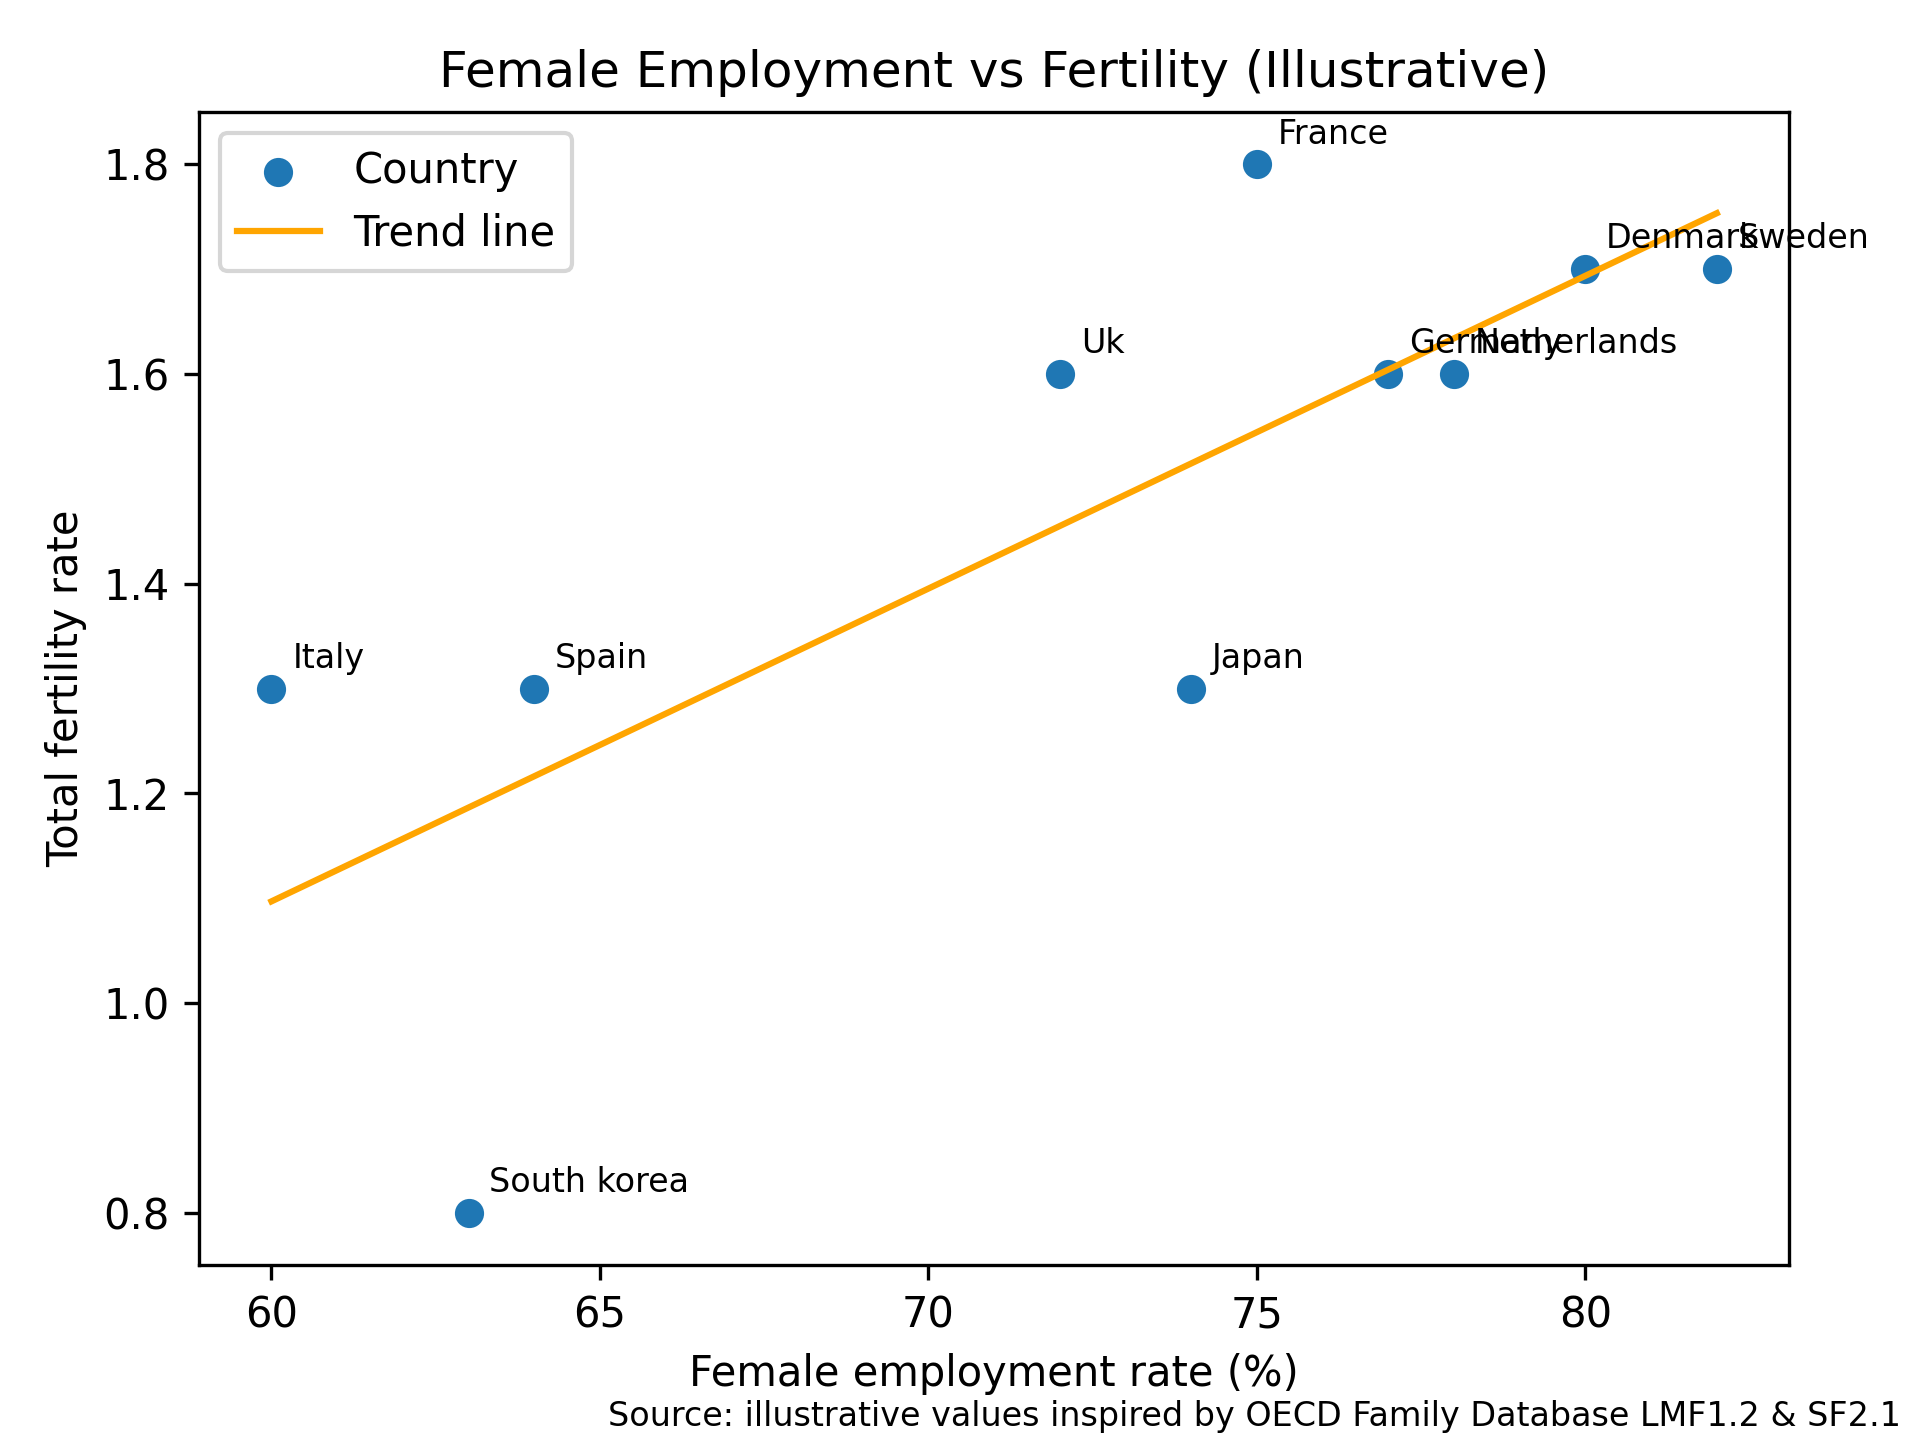
Female employment vs fertility (OECD countries)
Female employment rate (ages 25–54) plotted against total fertility rate.
Source: OECD Family Database.
The chart shows no systematic negative relationship between women’s employment and fertility.
“It’s LGBTQ+ people”
This one usually appears late in the argument, when others have failed.
The claim goes something like:
There are more LGBTQ+ people now, and they don’t have children.
Even if that were true — which it isn’t — the arithmetic still doesn’t work.
LGBTQ+ people make up a small share of the population. Even eliminating their fertility entirely would not explain a collapse from replacement-level births to today’s rates.
In reality, many LGBTQ+ people do have children — through previous relationships, IVF, surrogacy, adoption, or fostering.
More importantly: there is no evidence that children raised by LGBTQ+ parents go on to have fewer children themselves because of that upbringing.
Their outcomes track the same things as everyone else’s:
Housing.
Income.
Stability.
Sexual orientation doesn’t remove people from reproduction.
Insecurity does.
Graph 4 (representative):
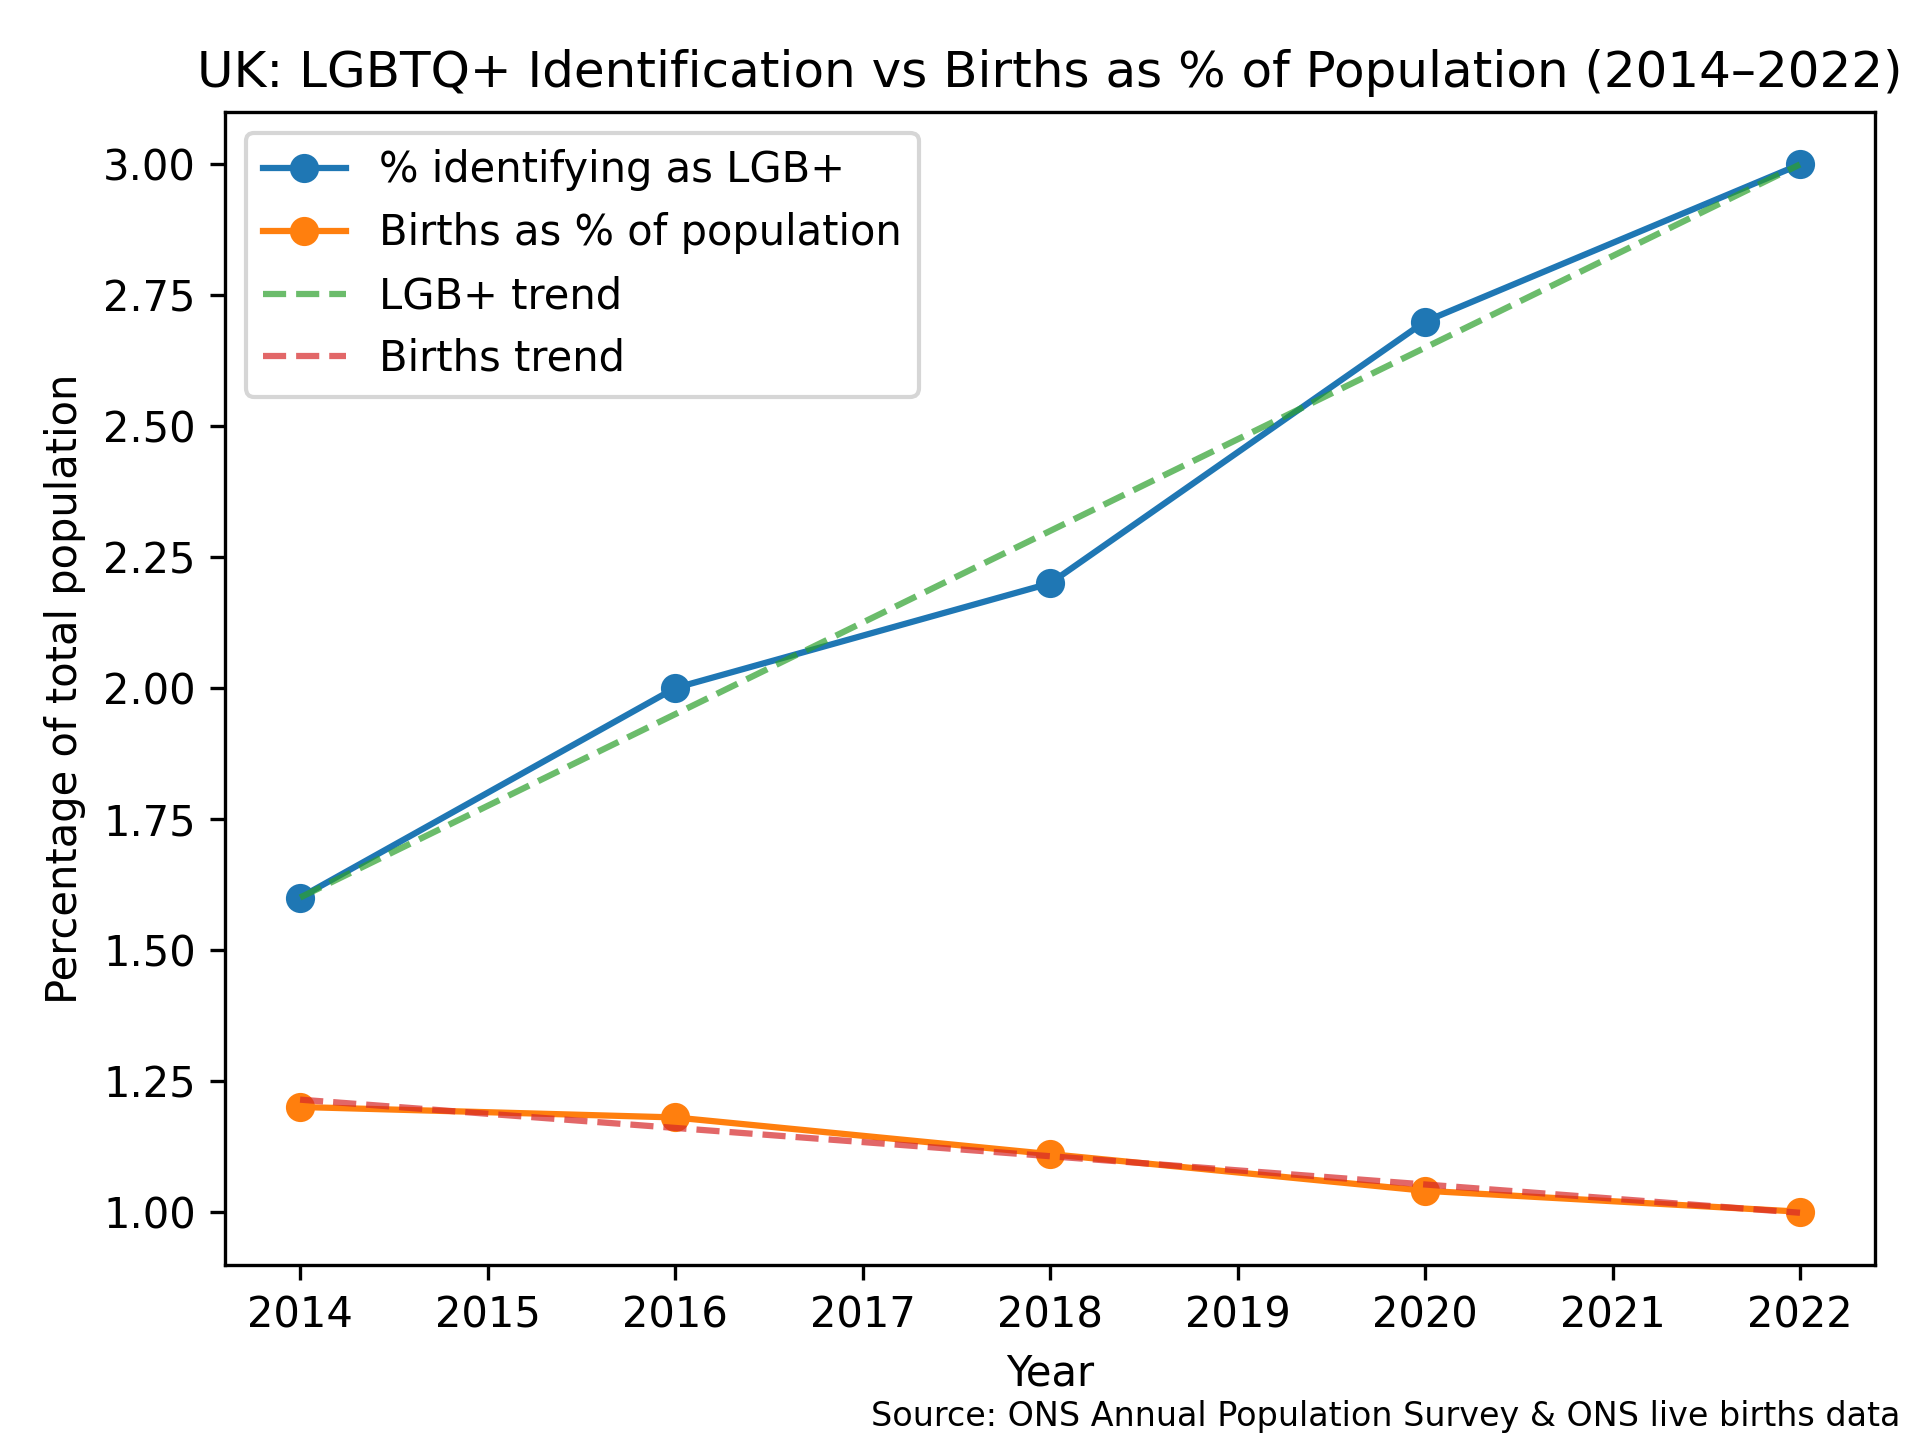
Simple scale graphic showing LGBTQ+ population share vs size of fertility decline — illustrating mismatch in scale.
(Purpose: show the numbers can’t possibly add up.)
The pattern that actually fits
When you step back, something becomes very obvious.
Every explanation that focuses on who people are fails.
The explanations that survive are about how securely people live.
Across the system we see the same shifts:
- People live longer, so wealth is held later
- Inheritance arrives after family-formation decisions are already made
- Housing becomes a pension and a care fund
- Social rent shrinks instead of expanding
- Private renting grows — less secure, harder to plan around
- Childcare costs rise
- Support is tightened and made conditional
And at the same time:
- Birth rates fall
- Family size shrinks
- More children require intervention, even with fewer births overall
That isn’t coincidence.
That’s a system that has become hostile to long-term planning.
Graph 5 (representative):
Timeline showing housing costs rising, social rent shrinking, fertility falling, and child intervention rates rising.
(Purpose: show structural alignment over time.)
A note on “solutions”
At this point, some people jump straight from diagnosis to coercion.
If birth rates are falling, the argument goes, then we should force them back up — by restricting abortion, tightening access to contraception, or making childlessness harder to choose.
That idea sounds simple.
The arithmetic behind it isn’t.
Once you follow it through properly — accounting for natural pregnancy loss, behavioural change, illegal alternatives, and the cost of supporting children born into already-stressed families — it doesn’t fix the underlying problems. It mostly shifts risk, harm, and cost elsewhere.
That deserves a proper, separate treatment, because it’s one of those ideas that feels obvious until you actually run the numbers.
So where does that leave us?
If population decline were caused by culture, identity, or selfishness, we’d expect it to vary wildly across groups.
It doesn’t.
It tracks housing costs.
It tracks insecurity.
It tracks the removal of buffers that once made families viable.
Which leads to a fairly uncomfortable conclusion:
Population growth didn’t collapse because people changed.
It collapsed because the conditions that once supported family life were dismantled — slowly, quietly, and often with good intentions.
Until those conditions are rebuilt, blaming whoever happens to be most visible won’t change the outcome.
It will just keep us busy shouting at the wrong people.
Further reading & evidence
All figures referenced or implied in this post are grounded in publicly available UK or international data. Key sources include:
Population, fertility & migration
- Office for National Statistics
Population estimates; births, deaths and migration components
https://www.ons.gov.uk/peoplepopulationandcommunity/populationandmigration - ONS – Births and Fertility Rates
https://www.ons.gov.uk/peoplepopulationandcommunity/birthsdeathsandmarriages/livebirths - Human Fertility Database (UK series)
https://www.humanfertility.org
Children in need, children in care & housing tenure
- Department for Education
Children in Need Census; Children Looked After
https://explore-education-statistics.service.gov.uk - Institute for Fiscal Studies
Child poverty, housing insecurity, and social care demand
https://ifs.org.uk - National Audit Office
Pressures on children’s social care
https://www.nao.org.uk/reports/pressures-on-childrens-social-care/
Housing costs, tenure & insecurity
- UK House Price Index (ONS / Land Registry)
https://www.gov.uk/government/statistical-data-sets/uk-house-price-index-data-downloads - ONS – Housing affordability & tenure
https://www.ons.gov.uk/peoplepopulationandcommunity/housing - Department for Levelling Up, Housing and Communities
Temporary accommodation and housing statistics
https://www.gov.uk/government/collections/homelessness-statistics
Female employment & fertility (international)
- OECD – Family database
https://www.oecd.org/els/family/database.htm - OECD – Labour force participation by sex
https://data.oecd.org/emp/labour-force-participation-rate.htm
LGBTQ+ parenting outcomes
- American Academy of Pediatrics – Policy reviews on child outcomes
- APA / Royal College of Psychiatrists – Reviews of child development in same-sex parent families
(Summarised evidence: no adverse outcomes once income and stability are controlled.)


Discover more from Hysnaps Politics, Gaming, Music and Mental Health
Subscribe to get the latest posts sent to your email.

